Automated storm reports for property claims.
Stormview turns the public atmospheric record — radar, satellite, soundings, surface observations — into clear, source-cited weather reports for any property and time window. Minutes, not the days-long standard.
Watch storms hit. Know first.
Radar, NWS warnings, storm reports and hail outlines on a map centered on you, and an alert the moment hail or a warning reaches your territory. On iPhone and Android, with the Storms map on the web.
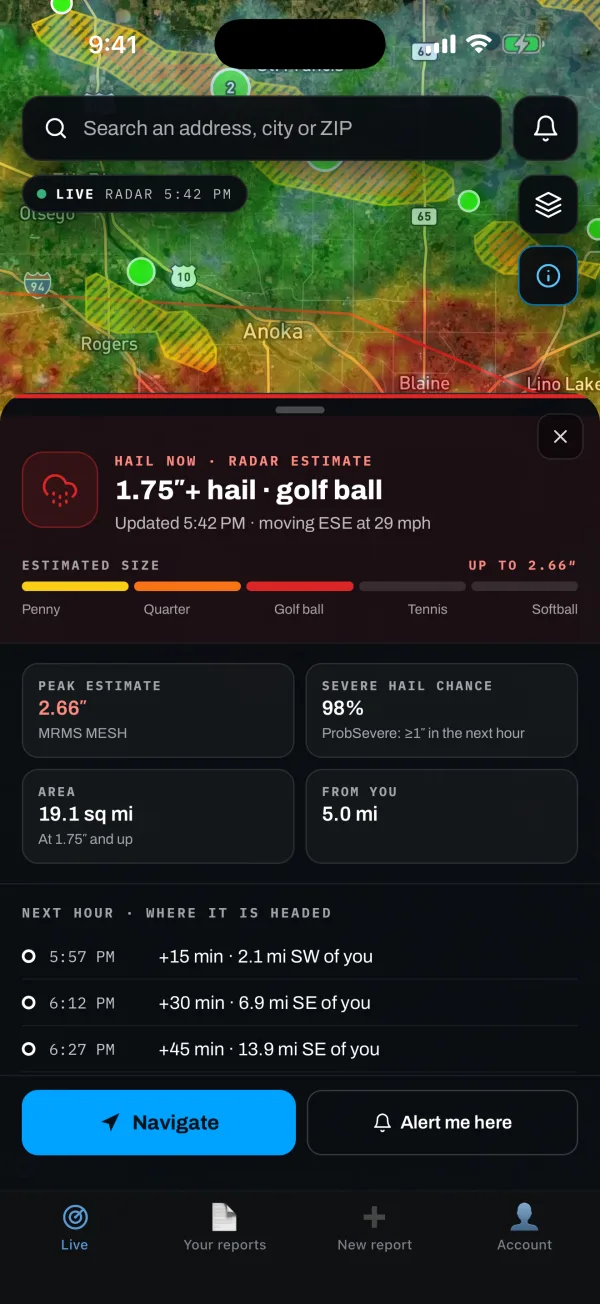
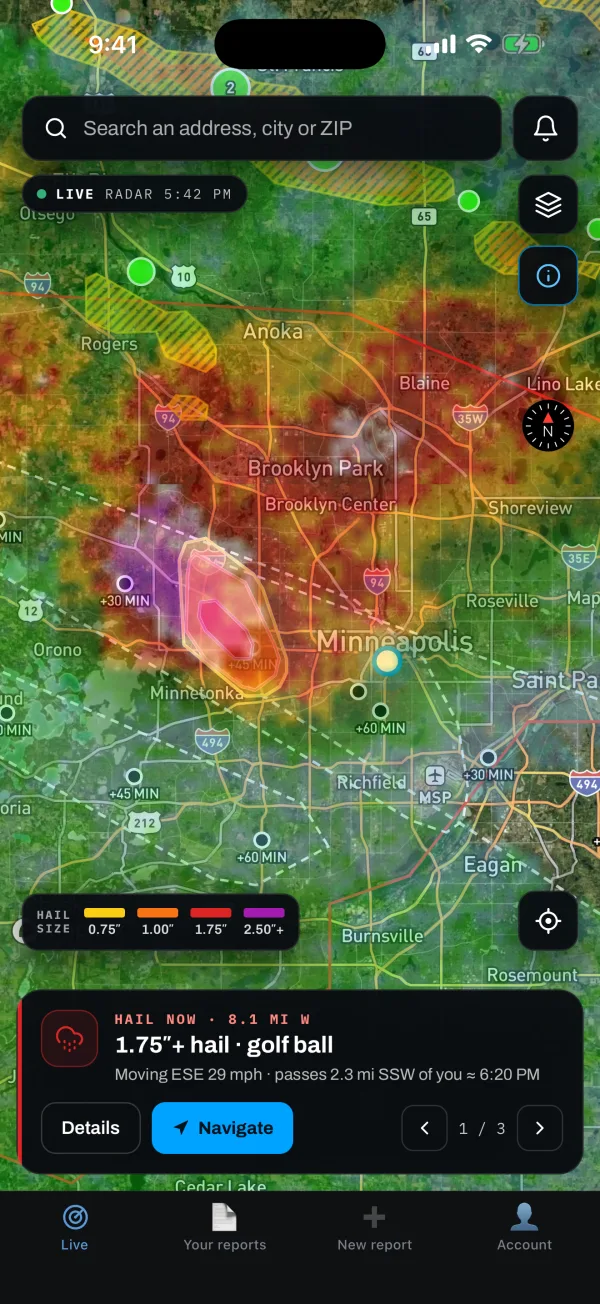
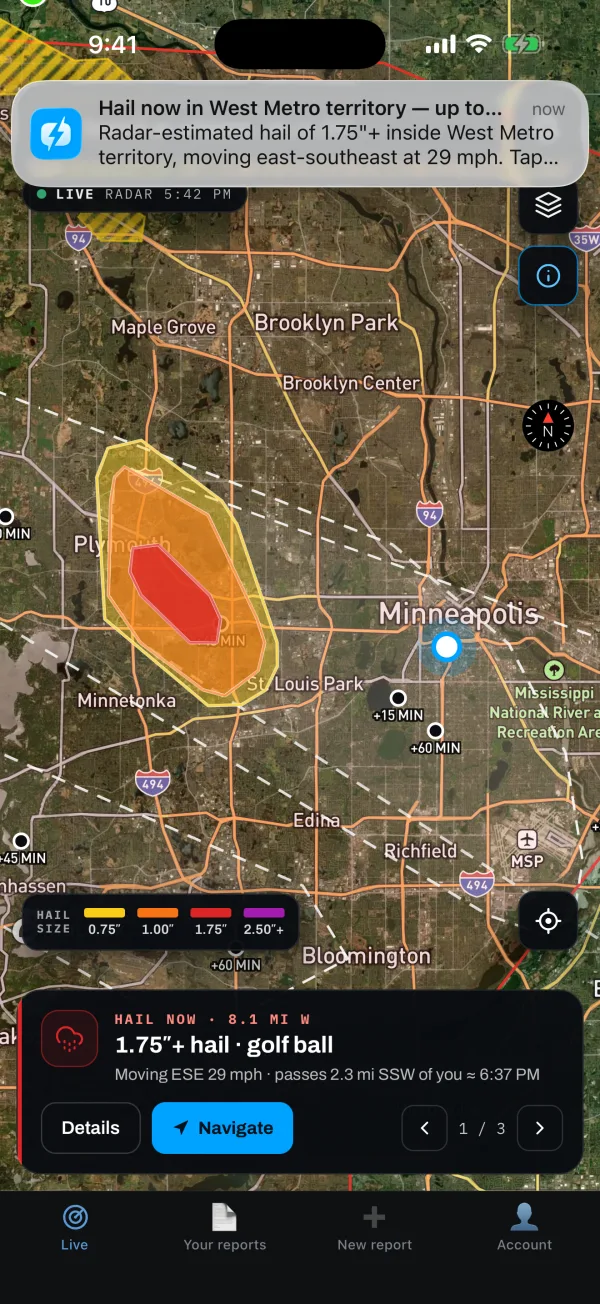
Hail outlines are radar estimates to plan your day, not a report. Reports bought one at a time don't include the Live map, storm alerts or hail outlines.
From an address to a source-cited report.
Type the property address, pick a date of loss or a lookback window, and choose your depth — a Storm Snapshot, a Detailed Analysis, or a Date-of-Loss Analysis pinned to one claimed date.
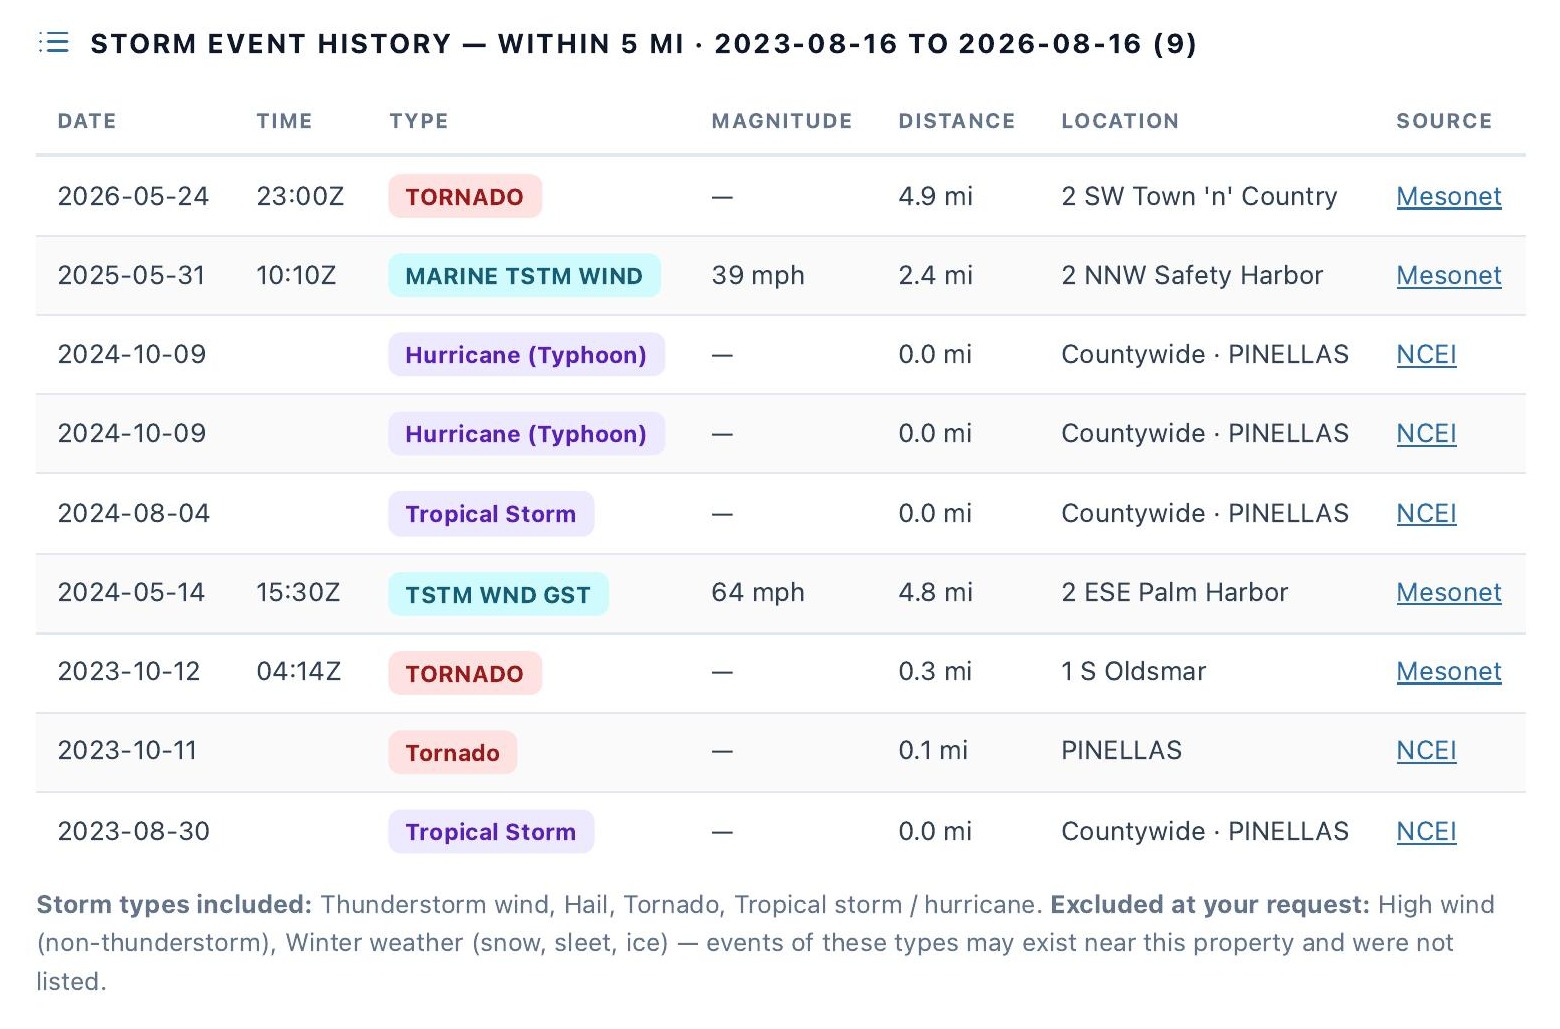
A Storm Snapshot lists every recorded storm event near the parcel, source-linked, in seconds. A Detailed Analysis goes further: radar, satellite, soundings and AFDs clustered into storms and evaluated per hazard, in minutes. A Date-of-Loss Analysis rebuilds one claimed date straight from the raw archive when no event is on the record for it.
Either way, every figure links to its official source — and the raw files behind the report — radar volumes, soundings, AFDs, LSR/NCEI records — are yours to download.
Pick your depth.
A factual record of every storm event near the property in your window, each linked to its official source. Makes no determination that any event caused damage.
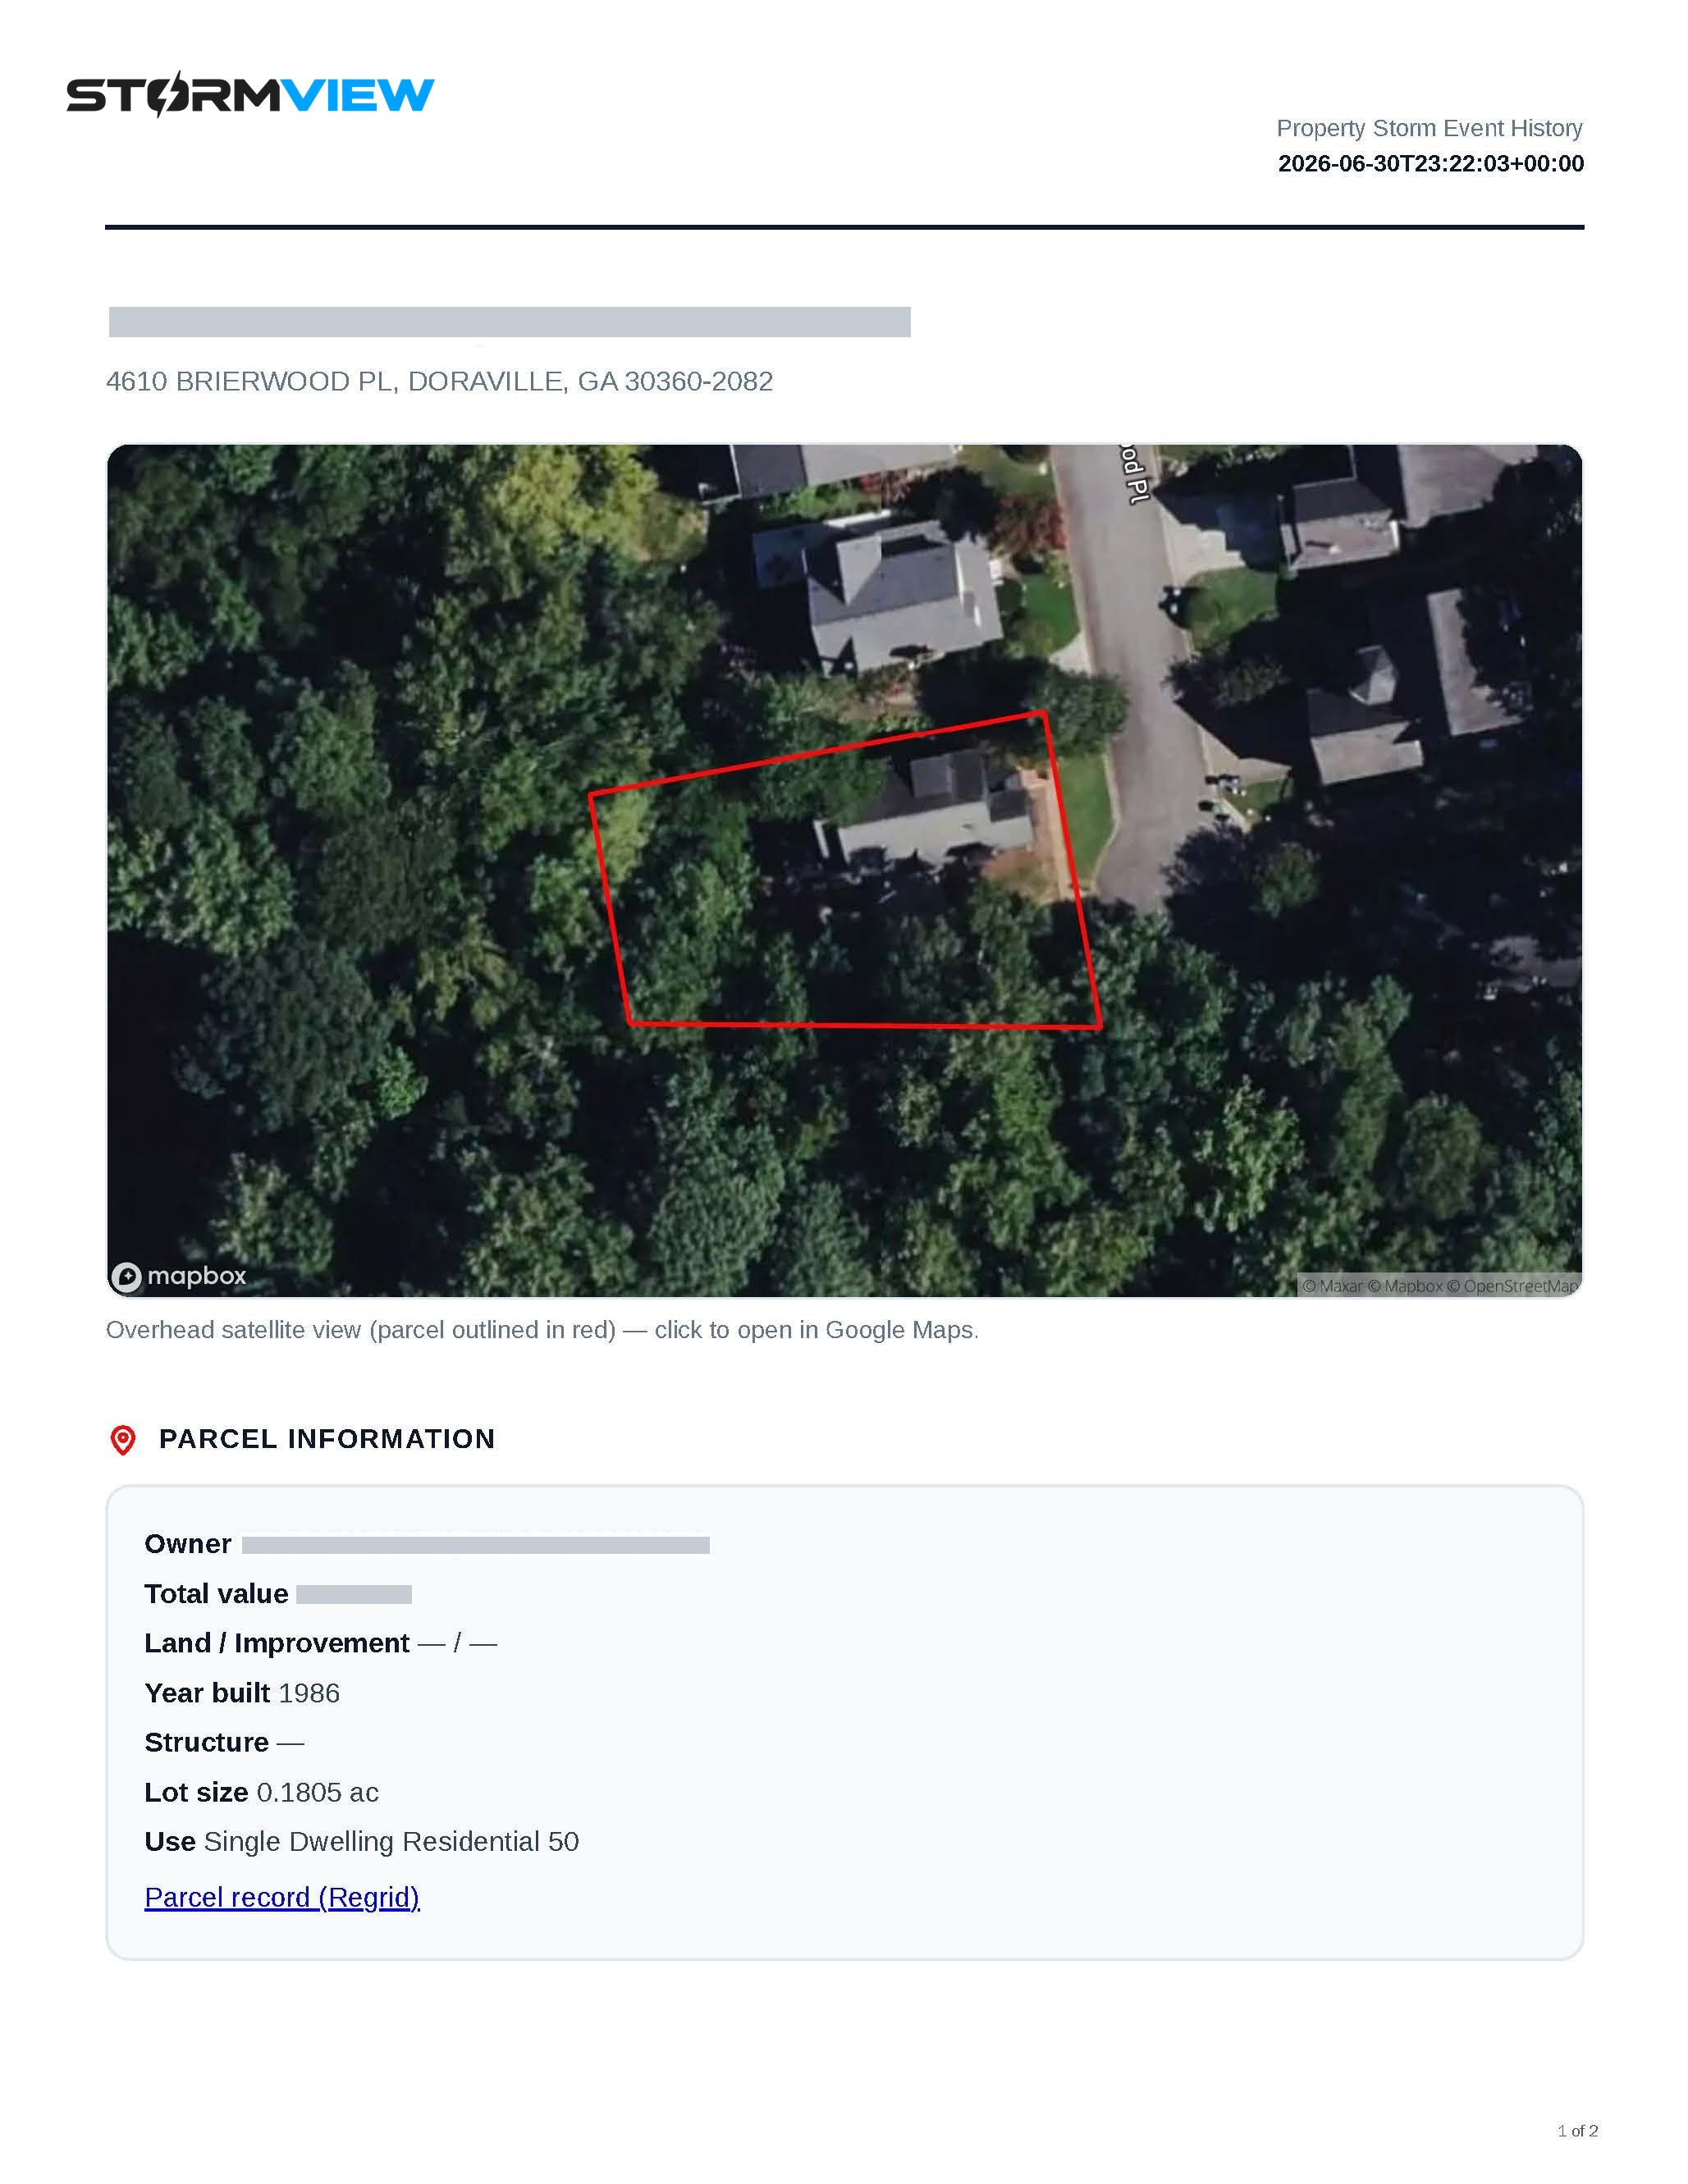
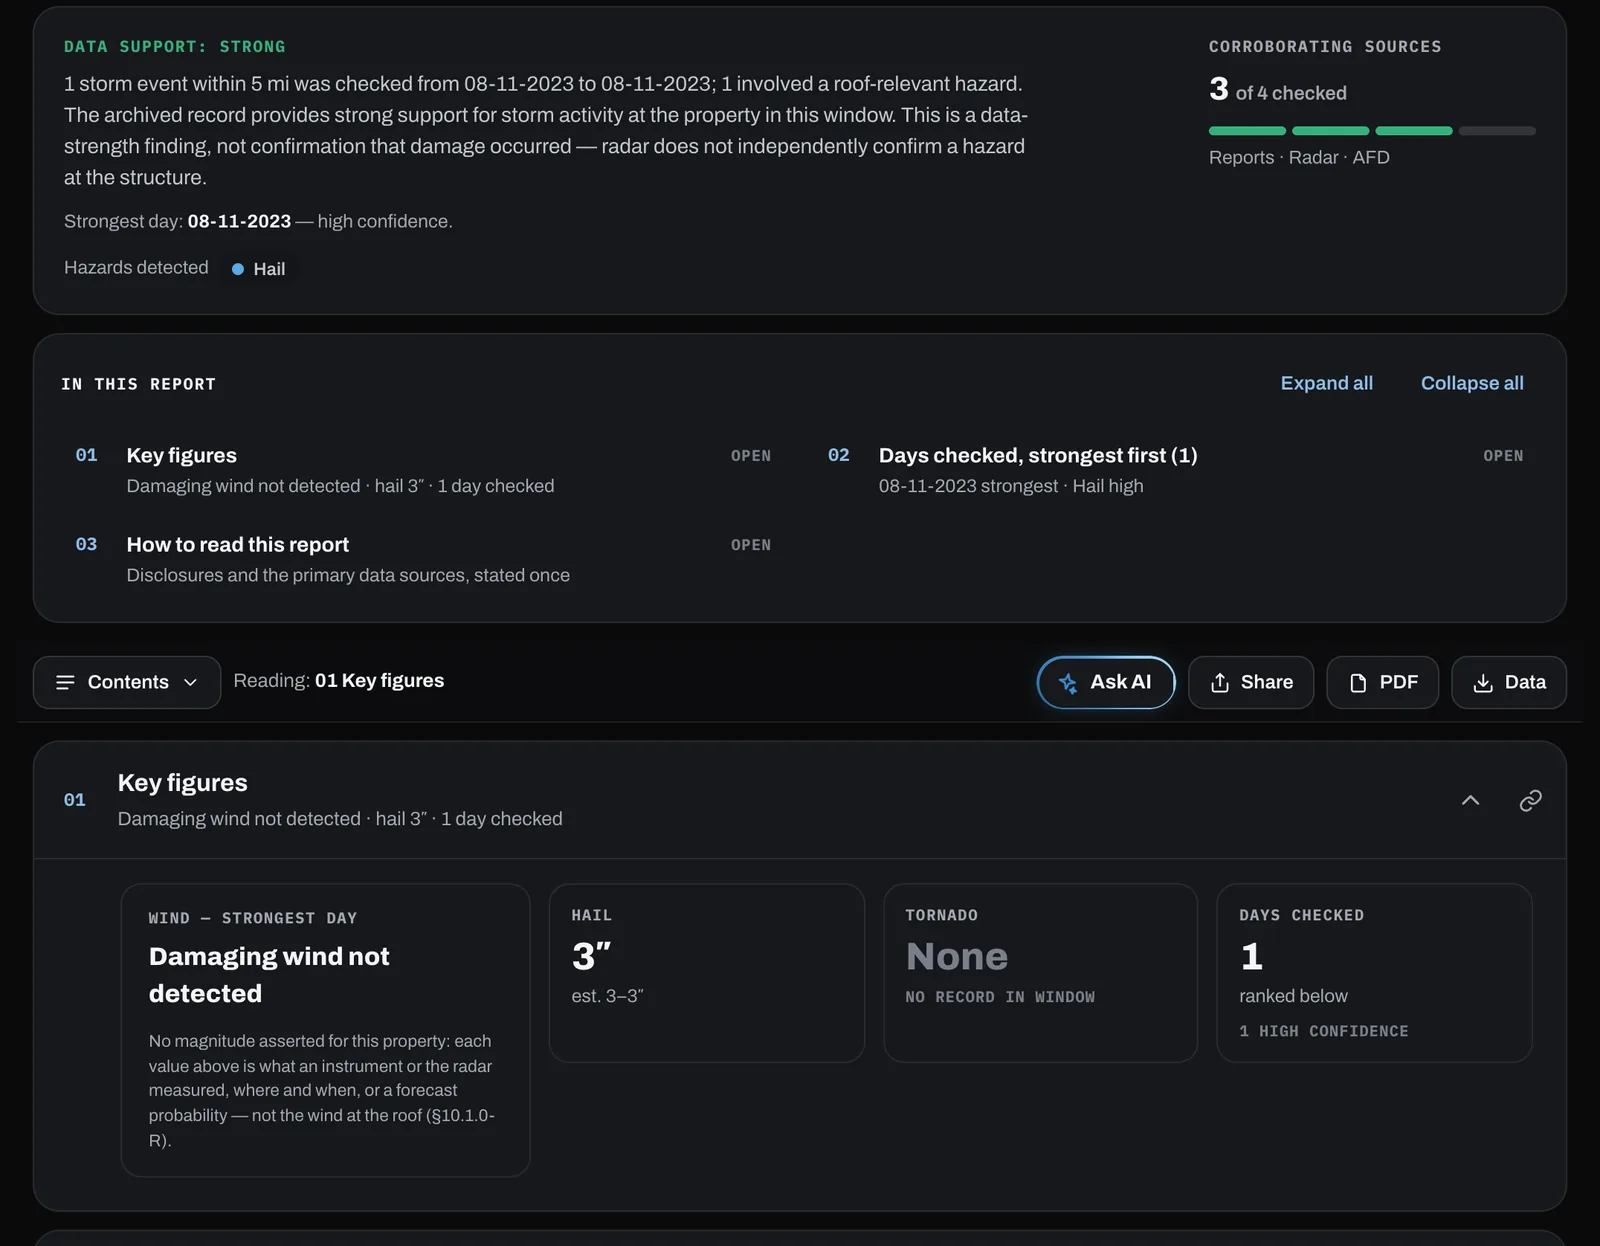
Each storm near the property scored for expected magnitude and confidence per hazard, with the reasoning, the source data, and nearby reported events behind it.
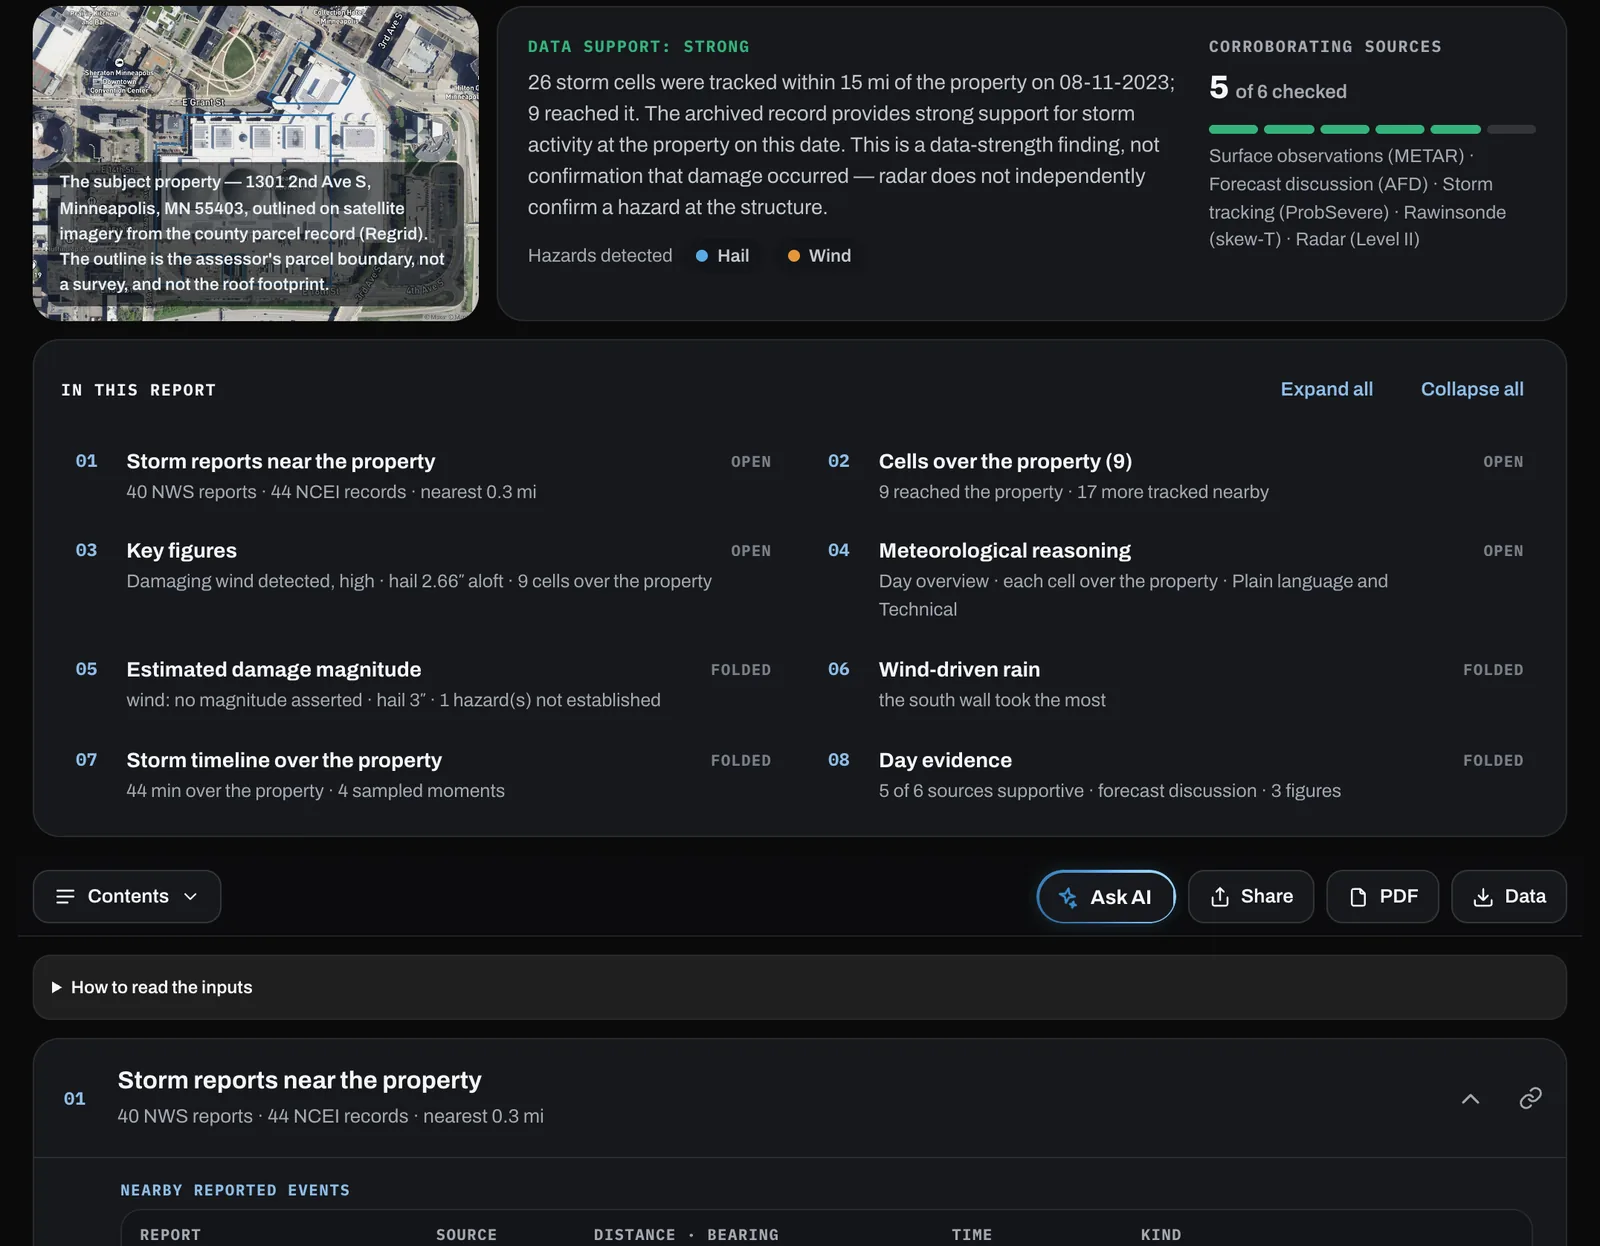
For a claimed date of loss with no storm event on the official record — rebuilt straight from the raw archive (radar, surface observations, forecast discussions, soundings) to show what the record supports for that day.
Start today on your own, or bring your whole team.
Create an account and order in minutes — no contract, no sales call. A monthly plan lowers the price of every report and turns on the Live storm map, storm alerts and hail outlines; nothing is capped and nothing expires.
- Every plan: the Live map, storm alerts and hail outlines, in the app and on the web
- Pay by card — or, on a plan, by bank account (ACH)
- Upgrade a Storm Snapshot and what you paid comes off
- No contract — cancel your plan any time
For organizations ordering at volume. Our enterprise team sets up your account with you — pricing, agreements, funding and your team — so it's ready on day one.
- Negotiated per-report pricing
- Prepaid report balance with automatic top-up, or monthly invoicing — card or ACH
- API ordering with webhooks into your claims system
- One company account for every adjuster, with admin controls
- Mutual NDA and Purchase Agreement (plus our API Agreement if you integrate)
- A named onboarding contact and a kickoff call
What it produced, and how well the data backs it.
Every storm is scored on two axes: expected magnitude — the estimated peak for the parcel vicinity, always shown with its method range — and confidence, how well independent sources corroborate that estimate. The report opens with a plain-language data support finding: how well the archived record supports storm activity at the property in the window.
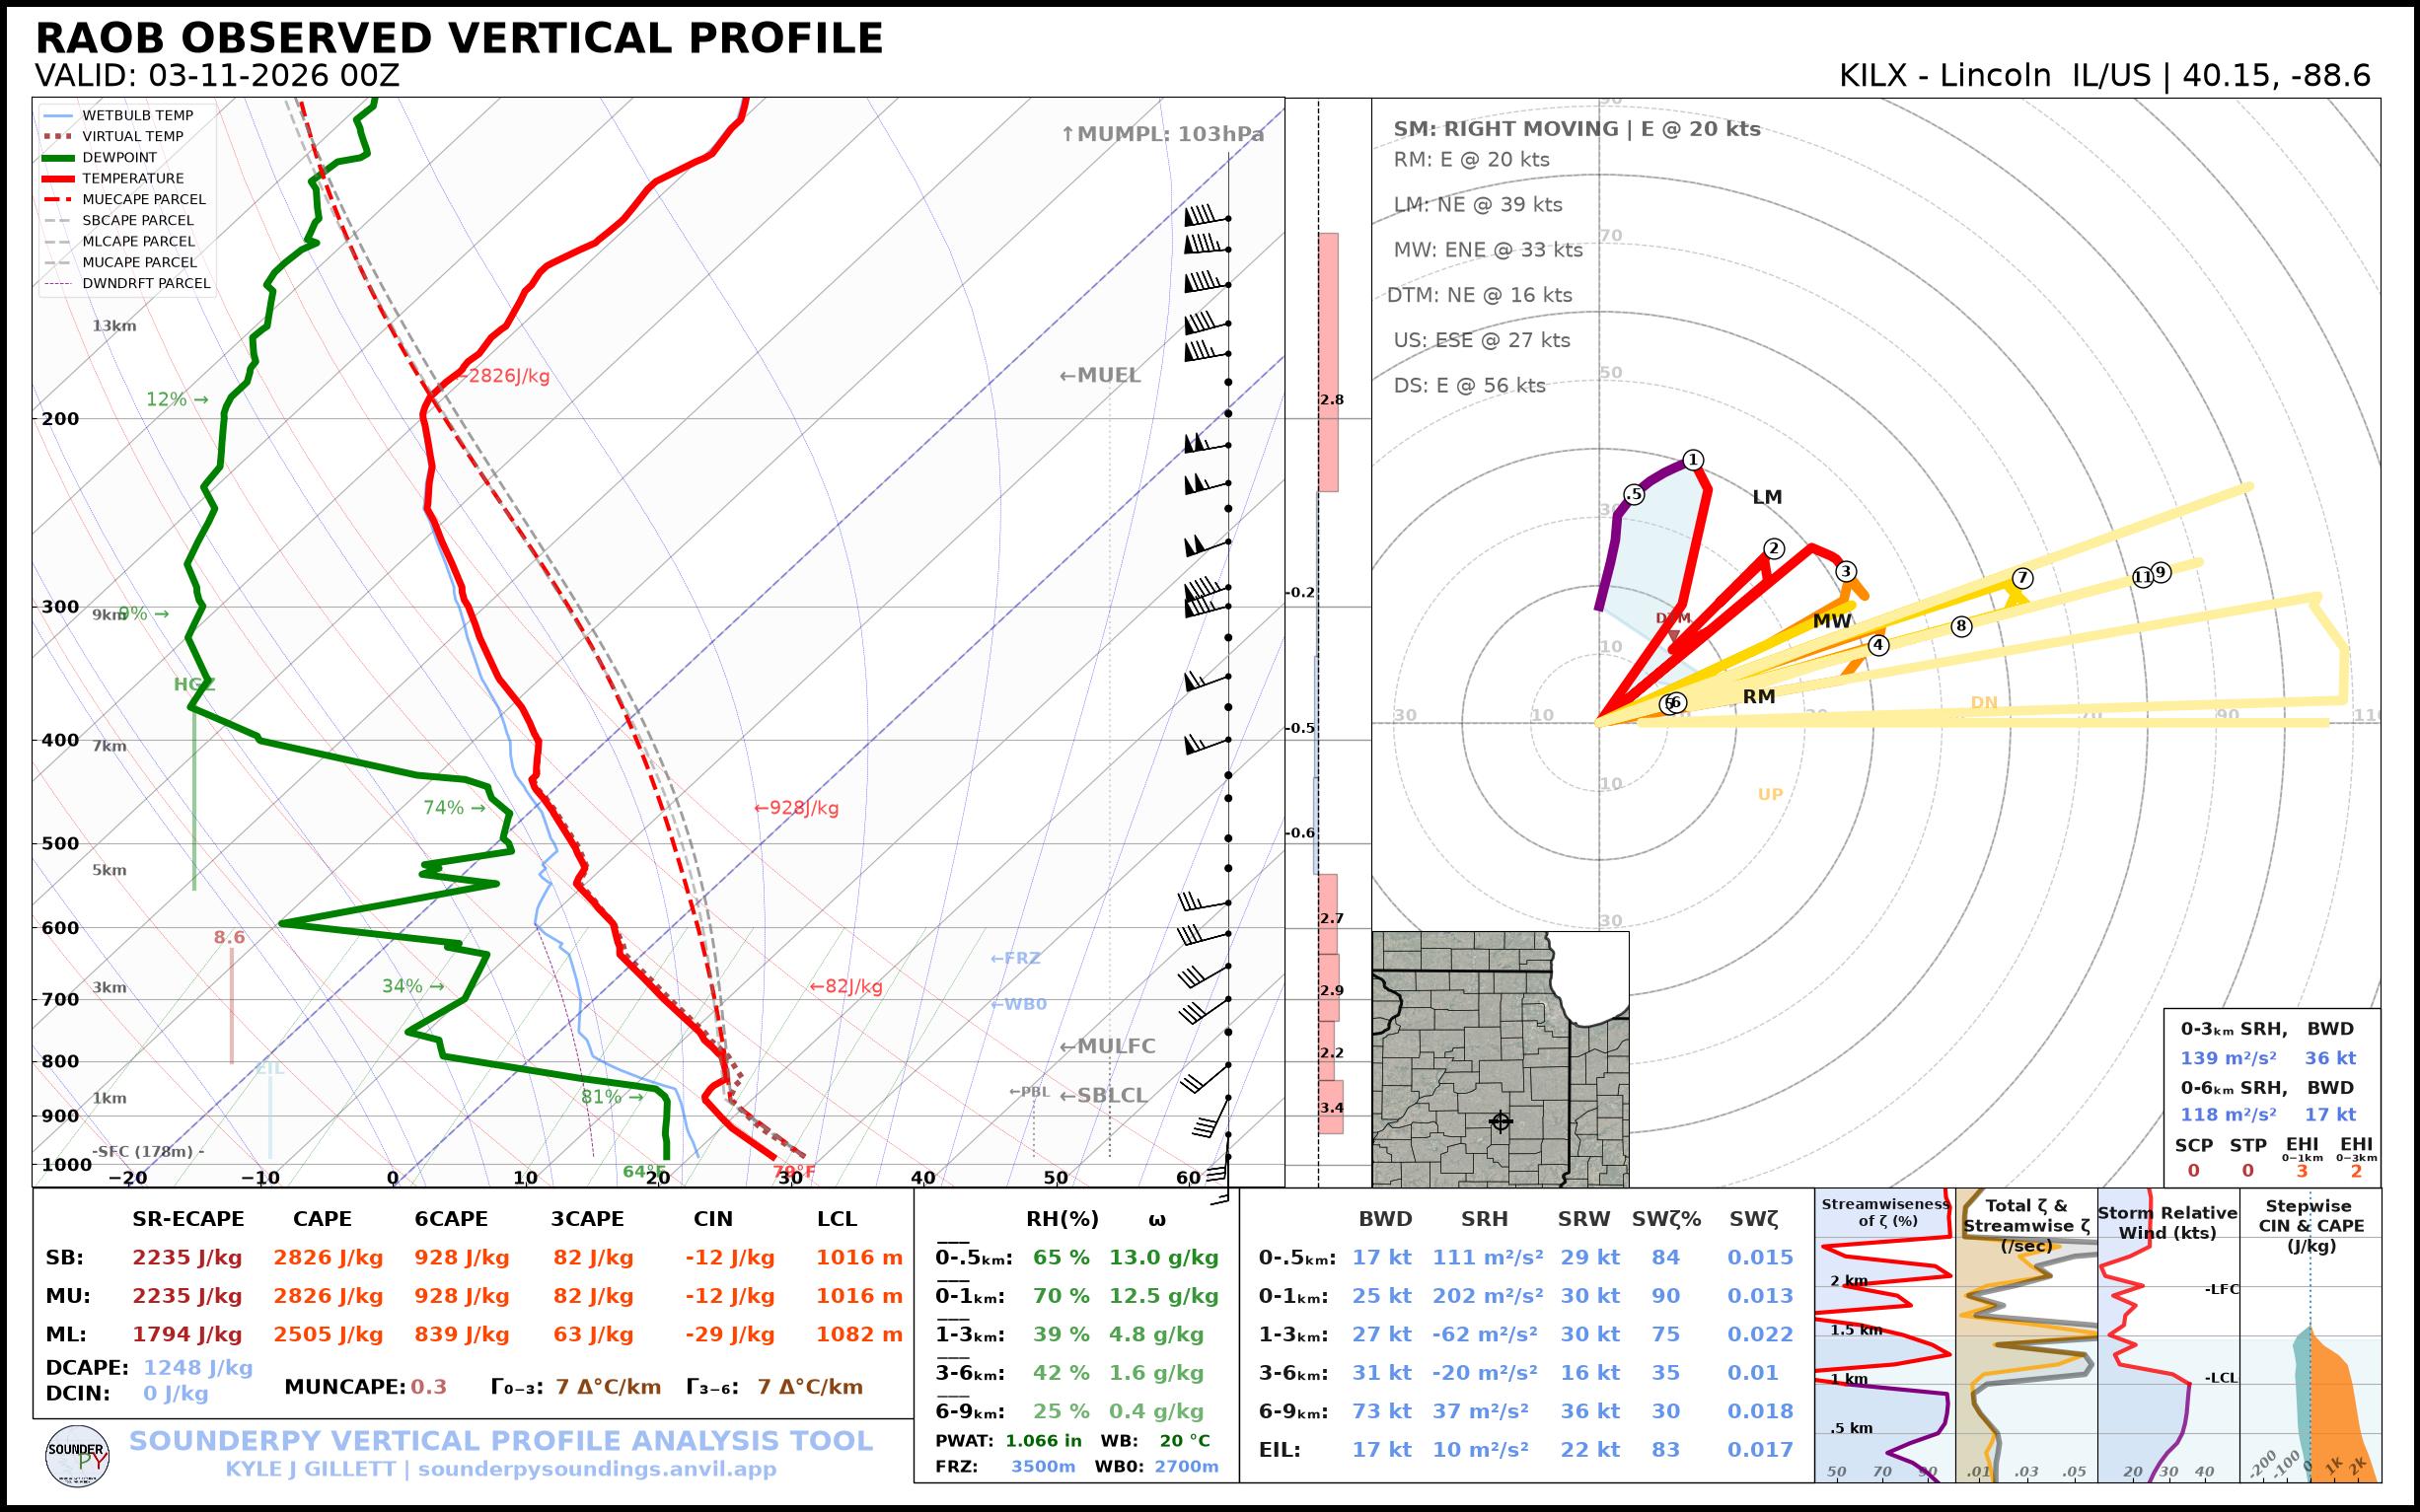
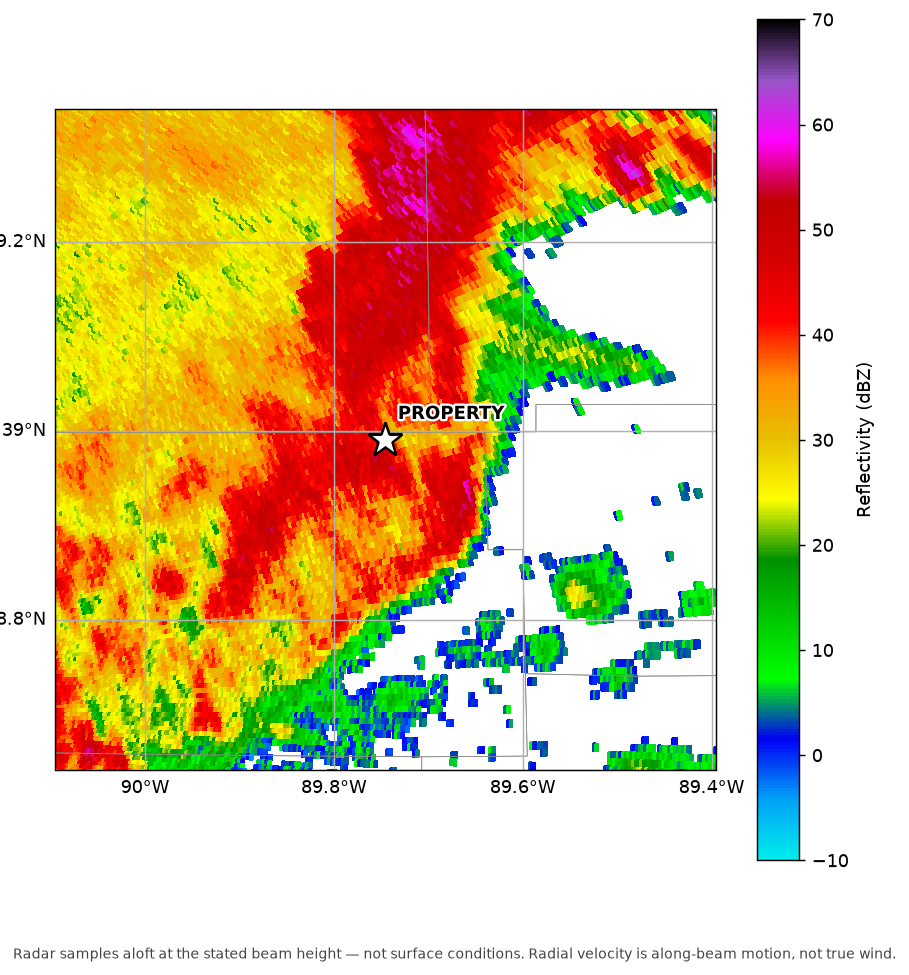
NEXRAD LEVEL II · KTBW
DELIVERED AS-CAPTURED —
FULL PLOTS, NO CROPS
The raw data, yours to keep.
Every report ships with its primary-source package: raw NEXRAD Level II radar volumes, skew-T soundings, AFDs, and LSR/NCEI records — with a manifest and a permanent link. The same data a reviewing meteorologist works from, so anyone can reproduce the analysis.
Certification: reviewed, annotated, signed.
A credentialed, named meteorologist reviews a Detailed Analysis, annotates the findings, and signs the report.

The team CBS 60 Minutes put on national television.
Showcased for making it free for homeowners to see their properties immediately after Hurricane Ian made landfall.
Watch the segment →Stop waiting days for a weather report.
Run one in minutes.
Run a Storm Snapshot in seconds, or a full Detailed Analysis in minutes — every figure source-cited, every raw file included.